In the world of service departments, labor is often the most significant expense. Efficiently staffing your service team is vital to ensure maximum profitability. Over the years, various models have been developed to help dealers determine their staffing needs, considering factors like the number of machines, revenue per technician, and more. In this article, we will explore different methods for calculating service department workforce and how to address factors like PTO liability and training needs.
Historical Model
Traditionally, dealers relied on models that considered the number of machines and pages produced. For instance, a technician covering a full product line in Segments 1 to 5 might manage 300 to 350 devices with a page count of around 1 million clicks. However, a printer technician would have a lower page count (about 750,000) but could handle a machine count from 500 to 750. High-volume production technicians might have as few as 75 devices but manage several million pages. These models offered some guidance, but they often lacked the flexibility needed for today’s evolving service environments.
Revenue-Based Models
Another approach to determine staffing needs was to use revenue per technician as a benchmark. This ranged from $350,000 to $550,000 in revenue per technician, depending on the mix of managed print services (MPS) business versus traditional MFP (Multi-Function Printing) customers. The higher the MPS ratio, the lower the revenue threshold per tech. While this model provides insight into staffing requirements, it may not consider all relevant factors, such as the geographic spread of service calls.
Modern Approach: Demand Time
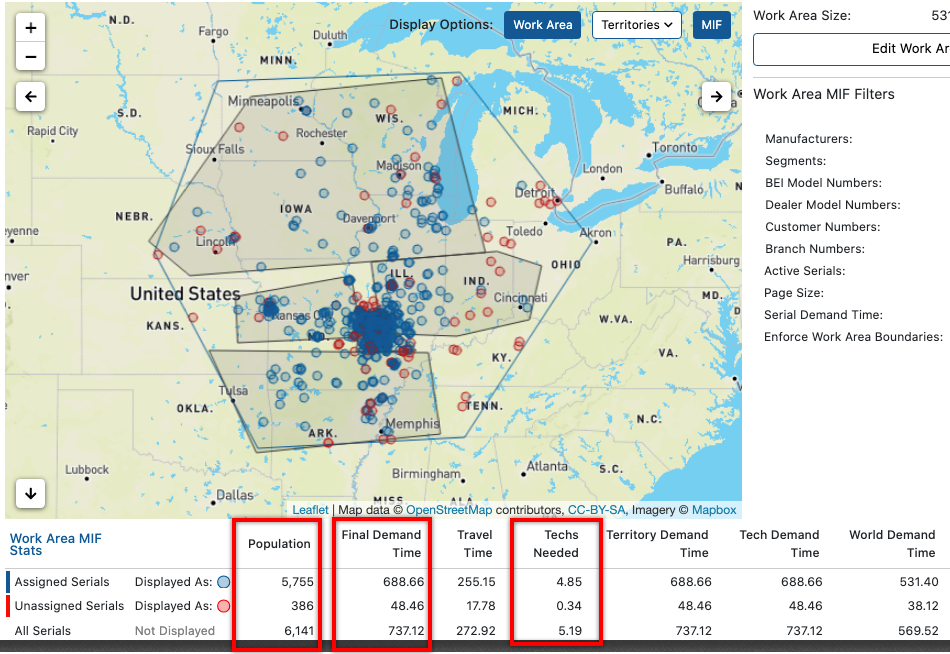
Today, the preferred method for calculating service department workforce is based on “Demand Time.” This approach, as referenced by Nexera, involves analyzing travel and maintenance time in a specific geographic area. This “Advanced Territory Management” method can automatically calculate the demand time, combining travel and maintenance, for a technician’s territory. On average, a technician should manage approximately 140 hours of demand time per month. By examining the total demand time for the entire service market covered, a dealer can extrapolate their overall workforce needs for the entire service area.

Accounting for PTO and Training
When utilizing the demand time method for workforce calculations, dealers must consider the “PTO Liability.” Service departments typically employ highly experienced technicians with a wealth of knowledge. However, this experience often comes at the cost of paid time off (PTO). Most technicians have as much as 4 to 5 weeks of PTO each year. Additionally, dealers should allocate time for training – on average, 80 hours (about 3 and a half days) per technician per year.
To illustrate the importance of accounting for PTO and training, consider a dealership with 14 technicians. After factoring in the PTO and training liabilities, the dealer might need an additional 2.5 technicians for the year to cover lost productivity due to technician time off and training needs.
Conclusion
Efficiently staffing your service team is crucial for maximizing profits. While traditional models have their merits, the demand time method offers a more precise and flexible approach for calculating workforce requirements. To ensure accurate calculations, dealers must consider factors like PTO liabilities and training needs. In today’s competitive market, it is essential to adopt advanced tools and methodologies for determining your service department’s workforce needs. If you need assistance with understanding your PTO liability or implementing these methods, reach out to the consultants at Nexera; they are always ready to help you make informed decisions.


